Get your patient on Metformin Hydrochloride - Metformin Hydrochloride tablet, Film Coated (Metformin Hydrochloride)
Metformin Hydrochloride - Metformin Hydrochloride tablet, Film Coated prescribing information
WARNINGS
WARNINGS: LACTIC ACIDOSIS:
Postmarketing cases of metformin-associated lactic acidosis have resulted in death, hypothermia, hypotension, and resistant bradyarrhythmias. The onset of metformin -associated lactic acidosis is often subtle, accompanied only by nonspecific symptoms such as malaise, myalgias, respiratory distress, somnolence, and abdominal pain. Metformin associated lactic acidosis was characterized by elevated blood lactate levels (>5 mmol/Liter), anion gap acidosis (without evidence of ketonuria or ketonemia), an increased lactate/pyruvate ratio; and metformin plasma levels generally >5 μg/mL (see PRECAUTIONS ).
Risk factors for metformin-associated lactic acidosis include renal impairment, concomitant use of certain drugs (e.g. carbonic anhydrase inhibitors such as topiramate), age 65 years old or greater, having a radiological study with contrast, surgery and other procedures, hypoxic states (e.g., acute congestive heart failure), excessive alcohol intake, and hepatic impairment.
Steps to reduce the risk of and manage metformin-associated lactic acidosis in these high risk groups are provided (see DOSAGE AND ADMINISTRATION , CONTRAINDICATIONS , and PRECAUTIONS ).
If metformin-associated lactic acidosis is suspected, immediately discontinue metformin hydrochloride tablets and institute general supportive measures in a hospital setting. Prompt hemodialysis is recommended (see PRECAUTIONS ).
INDICATIONS AND USAGE
Metformin hydrochloride tablets are indicated as an adjunct to diet and exercise to improve glycemic control in adults and children with type 2 diabetes mellitus.
DOSAGE AND ADMINISTRATION
There is no fixed dosage regimen for the management of hyperglycemia in patients with type 2 diabetes with metformin hydrochloride tablets or any other pharmacologic agent. Dosage of metformin hydrochloride tablets must be individualized on the basis of both effectiveness and tolerance, while not exceeding the maximum recommended daily doses. The maximum recommended daily dose of metformin hydrochloride tablets is 2550 mg in adults and 2000 mg in pediatric patients (10 to 16 years of age).
Metformin hydrochloride tablets should be given in divided doses with meals. Metformin hydrochloride tablets should be started at a low dose, with gradual dose escalation, both to reduce gastrointestinal side effects and to permit identification of the minimum dose required for adequate glycemic control of the patient.
During treatment initiation and dose titration (see Recommended Dosing Schedule ), fasting plasma glucose should be used to determine the therapeutic response to metformin hydrochloride tablets and identify the minimum effective dose for the patient. Thereafter, glycosylated hemoglobin should be measured at intervals of approximately three months. The therapeutic goal should be to decrease both fasting plasma glucose and glycosylated hemoglobin levels to normal or near normal by using the lowest effective dose of metformin hydrochloride tablets, either when used as monotherapy or in combination with sulfonylurea or insulin.
Monitoring of blood glucose and glycosylated hemoglobin will also permit detection of primary failure, i.e., inadequate lowering of blood glucose at the maximum recommended dose of medication, and secondary failure, i.e., loss of an adequate blood glucose lowering response after an initial period of effectiveness.
Short-term administration of metformin hydrochloride tablets may be sufficient during periods of transient loss of control in patients usually well-controlled on diet alone.
Recommended Dosing Schedule
Adults – The usual starting dose of metformin hydrochloride tablets USP is 500 mg twice a day or 850 mg once a day, given with meals. In general, clinically significant responses are not seen at doses below 1500 mg per day. Dosage increases should be made in increments of 500 mg weekly or 850 mg every 2 weeks, up to a total of 2000 mg per day, given in divided doses. The dosage of metformin hydrochloride tablets must be individualized on the basis of both effectiveness and tolerability. Patients can also be titrated from 500 mg twice a day to 850 mg twice a day after 2 weeks. For those patients requiring additional glycemic control, metformin hydrochloride tablets may be given to a maximum daily dose of 2550 mg per day. Doses above 2000 mg may be better tolerated given 3 times a day with meals.
Pediatrics – The usual starting dose of metformin hydrochloride tablets is 500 mg twice a day, given with meals. Dosage increases should be made in increments of 500 mg weekly up to a maximum of 2000 mg per day, given in divided doses. The dosage of metformin hydrochloride tablets must be individualized on the basis of both effectiveness and tolerability.
Recommendations for Use in Renal Impairment
Assess renal function prior to initiation of metformin hydrochloride tablets and periodically thereafter. Metformin hydrochloride tablets are contraindicated in patients with an estimated glomerular filtration rate (eGFR) below 30 mL/minute/1.73 m2.
Initiation of metformin hydrochloride tablets in patients with an eGFR between 30 to 45 mL/min/1.73 m2 is not recommended.
In patients taking metformin hydrochloride tablets whose eGFR later falls below 45 mL/min/1.73 m2, assess the benefit risk of continuing therapy.
Discontinue metformin hydrochloride tablets if the patient's eGFR later falls below 30 mL/min/1.73 m2 (See WARNINGS and PRECAUTIONS ).
Discontinuation for Iodinated Contrast Imaging Procedures
Discontinue metformin hydrochloride tablets at the time of, or prior to, an iodinated contrast imaging procedure in patients with an eGFR between 30 and 60 mL/min/1.73 m2; in patients with a history of liver disease, alcoholism, or heart failure; or in patients who will be administered intra-arterial iodinated contrast. Re-evaluate eGFR 48 hours after the imaging procedure; restart metformin hydrochloride if renal function is stable.
Concomitant Metformin Hydrochloride Tablets and Oral Sulfonylurea Therapy in Adult Patients
If patients have not responded to four weeks of the maximum dose of metformin hydrochloride tablet monotherapy, consideration should be given to gradual addition of an oral sulfonylurea while continuing metformin hydrochloride tablets at the maximum dose, even if prior primary or secondary failure to a sulfonylurea has occurred. Clinical and pharmacokinetic drug-drug interaction data are currently available only for metformin plus glyburide (glibenclamide).
With concomitant metformin hydrochloride tablet and sulfonylurea therapy, the desired control of blood glucose may be obtained by adjusting the dose of each drug. In a clinical trial of patients with type 2 diabetes and prior failure on glyburide, patients started on metformin hydrochloride tablets 500 mg and glyburide 20 mg were titrated to 1000/20 mg, 1500/20 mg, 2000/20 mg or 2500/20 mg of metformin hydrochloride tablets and glyburide, respectively, to reach the goal of glycemic control as measured by FPG, HbA1c and plasma glucose response (see CLINICAL PHARMACOLOGY: Clinical Studies). However, attempts should be made to identify the minimum effective dose of each drug to achieve this goal. With concomitant metformin hydrochloride tablets and sulfonylurea therapy, the risk of hypoglycemia associated with sulfonylurea therapy continues and may be increased. Appropriate precautions should be taken. (see Package Insert of the respective sulfonylurea.)
If patients have not satisfactorily responded to one to three months of concomitant therapy with the maximum dose of metformin hydrochloride tablets and the maximum dose of an oral sulfonylurea, consider therapeutic alternatives including switching to insulin with or without metformin hydrochloride tablets.
Concomitant Metformin Hydrochloride Tablet and Insulin Therapy in Adult Patients
The current insulin dose should be continued upon initiation of metformin hydrochloride tablet therapy. Metformin hydrochloride tablet therapy should be initiated at 500 mg once daily in patients on insulin therapy. For patients not responding adequately, the dose of metformin hydrochloride tablet should be increased by 500 mg after approximately 1 week and by 500 mg every week thereafter until adequate glycemic control is achieved. The maximum recommended daily dose is 2500 mg for metformin hydrochloride tablets. It is recommended that the insulin dose be decreased by 10% to 25% when fasting plasma glucose concentrations decrease to less than 120 mg/dL in patients receiving concomitant insulin and metformin hydrochloride tablets. Further adjustment should be individualized based on glucose-lowering response.
Specific Patient Populations
Metformin hydrochloride tablet is not recommended for use in pregnancy. Metformin hydrochloride tablets are not recommended in patients below the age of 10 years. The initial and maintenance dosing of metformin hydrochloride tablets should be conservative in patients with advanced age, due to the potential for decreased renal function in this population. Any dosage adjustment should be based on a careful assessment of renal function.
Special Populations
Patients with Type 2 Diabetes
In the presence of normal renal function, there are no differences between single- or multiple-dose pharmacokinetics of metformin between patients with type 2 diabetes and normal subjects (see TABLE 1), nor is there any accumulation of metformin in either group at usual clinical doses.
Renal Insufficiency
In patients with decreased renal function (based on measured creatinine clearance), the plasma and blood half-life of metformin is prolonged and the renal clearance is decreased in proportion to the decrease in creatinine clearance (see TABLE 1; also see CONTRAINDICATIONS , WARNINGS , PRECAUTIONS and DOSAGE AND ADMINISTRATION). DOSAGE AND ADMINISTRATION
Hepatic Insufficiency
No pharmacokinetic studies of metformin have been conducted in patients with hepatic insufficiency (see PRECAUTIONS ).
CONTRAINDICATIONS
A Metformin hydrochloride tablets are contraindicated in patients with:
- Severe renal impairment (eGFR below 30 mL/min/1.73 m2) (see WARNINGS and PRECAUTIONS ).
- Known hypersensitivity to metformin hydrochloride.
- Acute or chronic metabolic acidosis, including diabetic ketoacidosis, with or without coma. Diabetic ketoacidosis should be treated with insulin.
ADVERSE REACTIONS
In a US double-blind clinical study of metformin hydrochloride tablets in patients with type 2 diabetes, a total of 141 patients received metformin hydrochloride tablets therapy (up to 2550 mg per day) and 145 patients received placebo. Adverse reactions reported in greater than 5% of the metformin hydrochloride tablets patients, and that were more common in metformin hydrochloride tablets - than placebo-treated patients, are listed in Table 11.
Diarrhea led to discontinuation of study medication in 6% of patients treated with metformin hydrochloride tablets. Additionally, the following adverse reactions were reported in ≥1.0 to ≤5.0% of metformin hydrochloride tablets patients and were more commonly reported with metformin hydrochloride tablets than placebo: abnormal stools, hypoglycemia, myalgia, lightheaded, dyspnea, nail disorder, rash, sweating increased, taste disorder, chest discomfort, chills, flu syndrome, flushing, palpitation.
Pediatric Patients
In clinical trials with metformin hydrochloride tablets in pediatric patients with type 2 diabetes, the profile of adverse reactions was similar to that observed in adults.
To report SUSPECTED ADVERSE REACTIONS, please call Metcure Pharmaceuticals, Inc at 1-833-755-8327 or FDA at 1-800-FDA-1088 or www.fda.gov/medwatch.
DESCRIPTION
Metformin Hydrochloride Tablets USP are oral antihyperglycemic drugs used in the management of type 2 diabetes. Metformin hydrochloride (N,N-dimethylimidodicarbonimidic diamide hydrochloride) is not chemically or pharmacologically related to any other classes of oral antihyperglycemic agents. The structural formula is as shown:
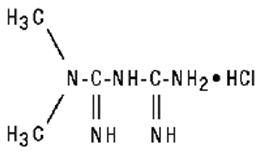
Metformin hydrochloride, USP is a white to off-white crystalline compound with a molecular formula of C4H11N5 • HCl and a molecular weight of 165.63. Metformin hydrochloride is freely soluble in water and is practically insoluble in acetone, ether, and chloroform. The pKa of metformin is 12.4. The pH of a 1% aqueous solution of metformin hydrochloride is 6.68.
Metformin hydrochloride tablets contain 500 mg, 850 mg, or 1000 mg of metformin hydrochloride. Each tablet contains the inactive ingredients povidone (K-30), povidone (K-90), pregelatinized starch, and magnesium stearate. In addition, the coating for the tablets contains artificial blackberry flavor, hypromellose and polyethylene glycol.
CLINICAL PHARMACOLOGY
Mechanism of Action
Metformin is an antihyperglycemic agent which improves glucose tolerance in patients with type 2 diabetes, lowering both basal and postprandial plasma glucose. Its pharmacologic mechanisms of action are different from other classes of oral antihyperglycemic agents. Metformin decreases hepatic glucose production, decreases intestinal absorption of glucose, and improves insulin sensitivity by increasing peripheral glucose uptake and utilization. Unlike sulfonylureas, metformin does not produce hypoglycemia in either patients with type 2 diabetes or normal subjects (except in special circumstances, see PRECAUTIONS ) and does not cause hyperinsulinemia. With metformin therapy, insulin secretion remains unchanged while fasting insulin levels and day-long plasma insulin response may actually decrease.
Pharmacokinetics
Absorption and Bioavailability
The absolute bioavailability of a metformin hydrochloride 500 mg tablet given under fasting conditions is approximately 50% to 60%. Studies using single oral doses of metformin hydrochloride 500 mg to 1500 mg, and 850 mg to 2550 mg, indicate that there is a lack of dose proportionality with increasing doses, which is due to decreased absorption rather than an alteration in elimination. Food decreases the extent of and slightly delays the absorption of metformin, as shown by approximately a 40% lower mean peak plasma concentration (Cmax), a 25% lower area under the plasma concentration versus time curve (AUC), and a 35-minute prolongation of time to peak plasma concentration (Tmax) following administration of a single 850 mg tablet of metformin with food, compared to the same tablet strength administered fasting. The clinical relevance of these decreases is unknown.
Distribution
The apparent volume of distribution (V/F) of metformin following single oral doses of metformin hydrochloride tablets 850 mg averaged 654 ± 358 L. Metformin is negligibly bound to plasma proteins, in contrast to sulfonylureas, which are more than 90% protein bound. Metformin partitions into erythrocytes, most likely as a function of time. At usual clinical doses and dosing schedules of metformin hydrochloride tablets, steady state plasma concentrations of metformin are reached within 24 to 48 hours and are generally <1 mcg/mL. During controlled clinical trials of metformin hydrochloride tablets, maximum metformin plasma levels did not exceed 5 mcg/mL, even at maximum doses.
Metabolism and Elimination
Intravenous single-dose studies in normal subjects demonstrate that metformin is excreted unchanged in the urine and does not undergo hepatic metabolism (no metabolites have been identified in humans) nor biliary excretion. Renal clearance (see TABLE 1) is approximately 3.5 times greater than creatinine clearance, which indicates that tubular secretion is the major route of metformin elimination. Following oral administration, approximately 90% of the absorbed drug is eliminated via the renal route within the first 24 hours, with a plasma elimination half-life of approximately 6.2 hours. In blood, the elimination half-life is approximately 17.6 hours, suggesting that the erythrocyte mass may be a compartment of distribution.
Special Populations
Patients with Type 2 Diabetes
In the presence of normal renal function, there are no differences between single- or multiple-dose pharmacokinetics of metformin between patients with type 2 diabetes and normal subjects (see TABLE 1), nor is there any accumulation of metformin in either group at usual clinical doses.
Renal Insufficiency
In patients with decreased renal function (based on measured creatinine clearance), the plasma and blood half-life of metformin is prolonged and the renal clearance is decreased in proportion to the decrease in creatinine clearance (see TABLE 1; also see CONTRAINDICATIONS , WARNINGS , PRECAUTIONS and DOSAGE AND ADMINISTRATION). DOSAGE AND ADMINISTRATION
Hepatic Insufficiency
No pharmacokinetic studies of metformin have been conducted in patients with hepatic insufficiency (see PRECAUTIONS ).
Geriatrics
Limited data from controlled pharmacokinetic studies of metformin hydrochloride tablets in healthy elderly subjects suggest that total plasma clearance of metformin is decreased, the half-life is prolonged, and Cmax is increased, compared to healthy young subjects. From these data, it appears that the change in metformin pharmacokinetics with aging is primarily accounted for by a change in renal function (see TABLE 1; also see WARNINGS , PRECAUTIONS and DOSAGE AND ADMINISTRATION). DOSAGE AND ADMINISTRATION
Pediatrics
After administration of a single oral metformin hydrochloride 500 mg tablet with food, geometric mean metformin Cmax and AUC differed less than 5% between pediatric type 2 diabetic patients (12 to 16 years of age) and gender- and weight-matched healthy adults (20 to 45 years of age), all with normal renal function.
Gender
Metformin pharmacokinetic parameters did not differ significantly between normal subjects and patients with type 2 diabetes when analyzed according to gender (males = 19, females = 16). Similarly, in controlled clinical studies in patients with type 2 diabetes, the antihyperglycemic effect of metformin hydrochloride tablets was comparable in males and females.
Race
No studies of metformin pharmacokinetic parameters according to race have been performed. In controlled clinical studies of metformin hydrochloride tablets in patients with type 2 diabetes, the antihyperglycemic effect was comparable in whites (n=249), blacks (n=51), and Hispanics (n=24).
Clinical Studies
METFORMIN HYDROCHLORIDE TABLETS
In a double-blind, placebo-controlled, multicenter U.S. clinical trial involving obese patients with type 2 diabetes whose hyperglycemia was not adequately controlled with dietary management alone (baseline fasting plasma glucose [FPG] of approximately 240 mg/dL), treatment with metformin hydrochloride tablets (up to 2550 mg/day) for 29 weeks resulted in significant mean net reductions in fasting and postprandial plasma glucose (PPG) and hemoglobin A1c (HbA1c) of 59 mg/dL, 83 mg/dL, and 1.8%, respectively, compared to the placebo group (see Table 2).
•All patients on diet therapy at Baseline ••Not statistically significant | |||
| Metformin Hydrochloride Tablets (n=141) | Placebo (n=145) | p–Value | |
| FPG (mg/dL) Baseline | 241.5 | 237.7 | NS•• |
| Change at FINAL VISIT | -53.0 | 6.3 | 0.001 |
| Hemoglobin A 1c (%) | |||
| Baseline | 8.4 | 8.2 | NS•• |
| Change at FINAL VISIT | -1.4 | 0.4 | 0.001 |
| Body Weight (lbs) | |||
| Baseline | 201.0 | 206.0 | NS•• |
| Change at FINAL VISIT | -1.4 | -2.4 | NS•• |
A 29-week, double-blind, placebo-controlled study of metformin hydrochloride tablets and glyburide, alone and in combination, was conducted in obese patients with type 2 diabetes who had failed to achieve adequate glycemic control while on maximum doses of glyburide (baseline FPG of approximately 250 mg/dL) (see Table 3). Patients randomized to the combination arm started therapy with metformin hydrochloride tablets 500 mg and glyburide 20 mg. At the end of each week of the first four weeks of the trial, these patients had their dosages of metformin hydrochloride tablets increased by 500 mg if they had failed to reach target fasting plasma glucose. After week four, such dosage adjustments were made monthly, although no patient was allowed to exceed metformin hydrochloride tablets 2500 mg. Patients in the metformin hydrochloride tablets only arm (metformin plus placebo) followed the same titration schedule. At the end of the trial, approximately 70% of the patients in the combination group were taking metformin hydrochloride tablets 2000 mg/glyburide 20 mg or metformin hydrochloride tablets 2500 mg/glyburide 20 mg. Patients randomized to continue on glyburide experienced worsening of glycemic control, with mean increases in FPG, PPG, and HbA1c of 14 mg/dL, 3 mg/dL, and 0.2%, respectively. In contrast, those randomized to metformin hydrochloride tablets (up to 2500 mg/day) experienced a slight improvement, with mean reductions in FPG, PPG, and HbA1c of 1 mg/dL, 6 mg/dL, and 0.4%, respectively. The combination of metformin hydrochloride tablets and glyburide was effective in reducing FPG, PPG, and HbA1c levels by 63 mg/dL, 65 mg/dL, and 1.7%, respectively. Compared to results of glyburide treatment alone, the net differences with combination treatment were -77 mg/dL, - 68 mg/dL, and -1.9%, respectively (see Table 3).
•All patients on glyburide, 20 mg/day, at Baseline ••Not statistically significant | ||||||
| p-values | ||||||
| Comb (n=213) | Glyb (n=209) | MET (n=210) | Glyb vs Comb | MET vs Comb | MET vs Glyb | |
| Fasting Plasma Glucose (mg/dL) | ||||||
| Baseline | 250.5 | 247.5 | 253.9 | NS•• | NS•• | NS•• |
| Change at FINAL VISIT | -63.5 | 13.7 | -0.9 | 0.001 | 0.001 | 0.025 |
| Hemoglobin A 1c (%) | ||||||
| Baseline | 8.8 | 8.5 | 8.9 | NS•• | NS•• | 0.007 |
| Change at FINAL VISIT | -1.7 | 0.2 | -0.4 | 0.001 | 0.001 | 0.001 |
| Body Weight (lbs) | ||||||
| Baseline | 202.2 | 203.0 | 204.0 | NS•• | NS•• | NS•• |
| Change at FINAL VISIT | 0.9 | -0.7 | -8.4 | 0.011 | 0.001 | 0.001 |
The magnitude of the decline in fasting blood glucose concentration following the institution of metformin hydrochloride tablets therapy was proportional to the level of fasting hyperglycemia. Patients with type 2 diabetes with higher fasting glucose concentrations experienced greater declines in plasma glucose and glycosylated hemoglobin.
In clinical studies, metformin hydrochloride tablets, alone or in combination with a sulfonylurea, lowered mean fasting serum triglycerides, total cholesterol, and LDL cholesterol levels and had no adverse effects on other lipid levels (see Table 4).
| Metformin Hydrochloride Tablets vs Placebo | Combined Metformin Hydrochloride Tablets/Glyburide vs Monotherapy | ||||
| Metformin Hydrochloride Tablets (n=141) | Placebo (n=145) | Metformin Hydrochloride Tablets (n=210) | Metformin Hydrochloride Tablets/ Glyburide (n=213) | Glyburide (n=209) | |
| Total Cholesterol (mg/dL) | |||||
| Baseline | 211.0 | 212.3 | 213.1 | 215.6 | 219.6 |
| Mean % Change at FINAL VISIT | -5% | 1% | -2% | -4% | 1% |
| Total Triglycerides (mg/dL) | |||||
| Baseline | 236.1 | 203.5 | 242.5 | 215.0 | 266.1 |
| Mean % Change at FINAL VISIT | -16% | 1% | -3% | -8% | 4% |
| LDL-Cholesterol (mg/dL) | |||||
| Baseline | 135.4 | 138.5 | 134.3 | 136.0 | 137.5 |
| Mean % Change at FINAL VISIT | -8% | 1% | -4% | -6% | 3% |
| HDL-Cholesterol (mg/dL) | |||||
| Baseline | 39.0 | 40.5 | 37.2 | 39.0 | 37.0 |
| Mean % Change at FINAL VISIT | 2% | -1% | 5% | 3% | 1% |
In contrast to sulfonylureas, body weight of individuals on metformin hydrochloride tablets tended to remain stable or even decrease somewhat (see Tables 2 and 3).
A 24-week, double-blind, placebo-controlled study of metformin hydrochloride tablets plus insulin versus insulin plus placebo was conducted in patients with type 2 diabetes who failed to achieve adequate glycemic control on insulin alone (see Table 5). Patients randomized to receive metformin hydrochloride tablets plus insulin achieved a reduction in HbA1c of 2.10%, compared to a 1.56% reduction in HbA1c achieved by insulin plus placebo. The improvement in glycemic control was achieved at the final study visit with 16% less insulin, 93.0 U/day vs 110.6 U/day, metformin hydrochloride tablets plus insulin versus insulin plus placebo, respectively, p=0.04.
a Statistically significant using analysis of covariance with baseline as covariate (p=0.04)Not significant using analysis of variance (values shown in table) | |||
b Statistically significant for insulin (p=0.04) | |||
| Metformin Hydrochloride Tablets/ Insulin (n=26) | Placebo/ Insulin (n=28) | Treatment difference Mean ± SE | |
| Hemoglobin A 1c (%) | |||
| Baseline | 8.95 | 9.32 | |
| Change at FINAL VISIT | -2.10 | -1.56 | -0.54 ± 0.43a |
| Insulin Dose (U/day) | |||
| Baseline | 93.12 | 94.64 | |
| Change at FINAL VISIT | -0.15 | 15.93 | -16.08 ± 7.77b |
A second double-blind, placebo-controlled study (n=51), with 16 weeks of randomized treatment, demonstrated that in patients with type 2 diabetes controlled on insulin for 8 weeks with an average HbA1c of 7.46 ± 0.97%, the addition of metformin hydrochloride tablets maintained similar glycemic control (HbA1c 7.15 ± 0.61 versus 6.97 ± 0.62 for metformin hydrochloride tablets plus insulin and placebo plus insulin, respectively) with 19% less insulin versus baseline (reduction of 23.68 ± 30.22 versus an increase of 0.43 ± 25.20 units for metformin hydrochloride tablets plus insulin and placebo plus insulin, p<0.01). In addition, this study demonstrated that the combination of metformin hydrochloride tablets plus insulin resulted in reduction in body weight of 3.11 ± 4.30 lbs, compared to an increase of 1.30 ± 6.08 lbs for placebo plus insulin, p=0.01.
A 24-week, double-blind, randomized study of metformin hydrochloride tablets, taken twice daily (with breakfast and evening meal), was conducted in patients with type 2 diabetes who had been treated with metformin hydrochloride 500 mg tablets twice daily for at least 8 weeks prior to study entry. The metformin hydrochloride tablets dose had not necessarily been titrated to achieve a specific level of glycemic control prior to study entry. Patients qualified for the study if HbA1c was ≤8.5% and FPG was ≤200 mg/dL. Changes in glycemic control and body weight are shown in Table 7.
• All patients on metformin hydrochloride tablets 500 mg twice daily at Baseline | |||
a n=68 | |||
| Metformin Hydrochloride Tablets | Metformin Hydrochloride Extended Release Tablets | ||
| 500 mg Twice Daily | 1000 mg Once Daily | 1500 mg Once Daily | |
| Hemoglobin A 1c (%) | (n=67) | (n=72) | (n=66) |
| Baseline | 7.06 | 6.99 | 7.02 |
| Change at 12 Weeks | 0.14 | 0.23 | 0.04 |
| (95% CI) | (-0.03, 0.31) | (0.10, 0.36) | (-0.08, 0.15) |
| Change at FINAL VISIT | 0.14a | 0.27 | 0.13 |
| (95% CI) | (-0.04, 0.31) | (0.11, 0.43) | (-0.02, 0.28) |
| FPG (mg/dL) | (n=69) | (n=72) | (n=70) |
| Baseline | 127.2 | 131.0 | 131.4 |
| Change at 12 Weeks | 12.9 | 9.5 | 3.7 |
| (95% CI) | (6.5, 19.4) | (4.4, 14.6) | (-0.4, 7.8) |
| Change at FINAL VISIT | 14.0 | 11.5 | 7.6 |
| (95% CI) | (7.0, 21.0) | (4.4, 18.6) | (1.0, 14.2) |
| Body Weight (lbs) | (n=71) | (n=74) | (n=71) |
| Baseline | 210.3 | 202.8 | 192.7 |
| Change at 12 Weeks | 0.4 | 0.9 | 0.7 |
| (95% CI) | (-0.4, 1.5) | (0.0, 2.0) | (-0.4, 1.8) |
| Change at FINAL VISIT | 0.9 | 1.1 | 0.9 |
| (95% CI) | (-0.4, 2.2) | (-0.2, 2.4) | (-0.4, 2.0) |
After 12 weeks of treatment, there was an increase in mean HbA1c in all groups.
Changes in lipid parameters in the previously described study of metformin hydrochloride extended release tablets are shown in Table 9.
• All patients on metformin hydrochloride tablets 500 mg twice daily at Baseline | |||
| Metformin Hydrochloride Tablets | Metformin Hydrochloride Extended Release Tablets | ||
| 500 mg Twice Daily | 1000 mg Once | 1500 mg Once | |
| Total Cholesterol (mg/dL) | (n=68) | (n=70) | (n=66) |
| Baseline | 199.0 | 201.9 | 201.6 |
| Mean % Change at FINAL VISIT | 0.1% | 1.3% | 0.1% |
| Total Triglycerides (mg/dL) | (n=68) | (n=70) | (n=66) |
| Baseline | 178.0 | 169.2 | 206.8 |
| Mean % Change at FINAL VISIT | 6.3% | 25.3% | 33.4% |
| LDL-Cholesterol (mg/dL) | (n=68) | (n=70) | (n=66) |
| Baseline | 122.1 | 126.2 | 115.7 |
| Mean % Change at FINAL VISIT | -1.3% | -3.3% | -3.7% |
| HDL-Cholesterol (mg/dL) | (n=68) | (n=70) | (n=65) |
| Baseline | 41.9 | 41.7 | 44.6 |
| Mean % Change at FINAL VISIT | 4.8% | 1.0% | -2.1% |
Pediatric Clinical Studies
In a double-blind, placebo-controlled study in pediatric patients aged 10 to 16 years with type 2 diabetes (mean FPG 182.2 mg/dL), treatment with metformin hydrochloride tablets (up to 2000 mg/day) for up to 16 weeks (mean duration of treatment 11 weeks) resulted in a significant mean net reduction in FPG of 64.3 mg/dL, compared with placebo (see Table 10).
a Pediatric patients mean age 13.8 years (range 10 to 16 years) | |||
• All patients on diet therapy at Baseline | |||
•• Not statistically significant | |||
| Metformin Hydrochloride Tablets | Placebo | p-Value | |
| FPG (mg/dL) | (n=37) | (n=36) | |
| Baseline | 162.4 | 192.3 | |
| Change at FINAL VISIT | -42.9 | 21.4 | <0.001 |
| Body Weight (lbs) | (n=39) | (n=38) | |
| Baseline | 205.3 | 189.0 | |
| Change at FINAL VISIT | -3.3 | -2.0 | NS•• |
HOW SUPPLIED
Metformin Hydrochloride Tablets, USP
500 mg - White to off-white, round, biconvex, film coated tablets debossed with G over 10 on one side and plain on the other side.
Bottles of 500 NDC 71709-110-06
850 mg - White to off-white, round, biconvex, film coated tablets debossed with G over 11 on one side and plain on the other side.
Bottles of 500 NDC 71709-111-06
1000 mg - White to off-white, oval, biconvex, scored, film coated tablets debossed with G and 12 on either side of the scoreline on one side and plain on the other side.
Bottles of 500 NDC 71709-112-06
Storage
Store at 20°–25° C (68°–77° F); excursions permitted to 15°–30° C (59°–86° F). [See USP Controlled Room Temperature.]
Dispense in tight, light-resistant containers with child-resistant closure.
Distributed By:
Metcure Pharmaceuticals, Inc
18 Campus Blvd., Suite 100
Newtown Square, PA 19073
Manufactured by:
Granules India Limited
Hyderabad-500081, INDIA
MADE IN INDIA
Jul 2017
M.L.No.: 37/RR/AP/2003/F/R
Mechanism of Action
Metformin is an antihyperglycemic agent which improves glucose tolerance in patients with type 2 diabetes, lowering both basal and postprandial plasma glucose. Its pharmacologic mechanisms of action are different from other classes of oral antihyperglycemic agents. Metformin decreases hepatic glucose production, decreases intestinal absorption of glucose, and improves insulin sensitivity by increasing peripheral glucose uptake and utilization. Unlike sulfonylureas, metformin does not produce hypoglycemia in either patients with type 2 diabetes or normal subjects (except in special circumstances, see PRECAUTIONS ) and does not cause hyperinsulinemia. With metformin therapy, insulin secretion remains unchanged while fasting insulin levels and day-long plasma insulin response may actually decrease.